Lifecycle marketing
Customer lifetime value: A practical approach to calculating LTV in ecommerce
Brant Cebulla

Customer lifetime value (abbreviated as CLV or LTV) is important to establish in any business. It allows the company to evaluate how much profit they’re able to make on a per-customer basis and plan their marketing spend accordingly.
While it is not quite this simple, the general idea is that:
if the LTV of a customer is greater than the cost to acquire the customer (acquisition cost, or AC), then the company should increase their marketing spend.
if the LTV of a customer is lower than the AC, then the company should decrease their marketing spend.
Of course, some companies (eg startups that are venture capital financed) do not mind when their LTV is lower than their AC, when growth and adoption are top of mind rather than profitability.
In addition to establishing what you’re willing to spend in AC, LTV is a useful calculation to think about levers. Establishing an LTV provides a framework to think about what kind of initiatives in your company will improve the LTV of your customers: eg improving your products, your customer support, your email marketing, etc.
Calculating LTV
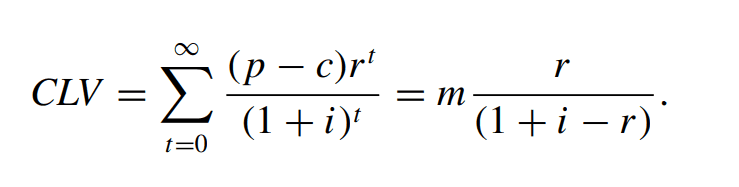
The classic formulas for LTV are the following formulas, very much built with subscriptions in mind. I will explain how we can adopt the second formula to ecommerce.

Where in the top formula:
p is price of goods to consumer (ie, topline sales or gross merchandising value)
c is cost of goods
r is retention rate from period to period
i is discount rate (also known as cost of capital or can be thought of as interest rate to firm)
t is nth time, usually in years (though we’ll use months below)
This formula simplifies to the bottom formula, where:
m is margin (ie price minus costs)
And retention is the same rate overtime. And margin is the same overtime.
In practice, these formula are messy for lots of reasons for ecommerce companies:
Retention is not that simple: typically a customer’s greatest spend is in the first couple months post-acquisition, then their spend drops off dramatically. The customer may or may not return, and it will not be linear. Some customers may come back in 3 months, some will come back in 12 months, etc. Trying to establish a retention rate in a time series is challenging.
After the initial drop off in spend following a customer’s first purchase, customers then tend to spend more every additional nth purchase or nth time. Trying to establish an average margin in the time series is tricky in ecommerce.
However, we will use this formula, with a few adaptations:
The first adaptation is that we’re going to think about retention as “revenue-retention”. We want to know: how much revenue are we retaining from our cohorts month to month. This tends to be linear on a cohort basis, and we don’t have to worry about when customers are returning. We just need to know how much revenue is being retained from our cohorts over time.
The second adaptation is that we’re going to split out margin into two different time periods: revenue from our first month with the customers (P0), then revenue thereafter (P1). This will make sense with a very realistic dataset below.
Putting it in practice
We’ll use this sample dataset below, already organized in the following specific way:
I like organizing my data in a way that anyone can understand, with a class retention chart. I have my cohorts on the left (by month of their first purchase), then the number of distinct new customers from that month, then the revenue from that cohort every month thereafter.
Revenue by first-purchase cohort by purchase month
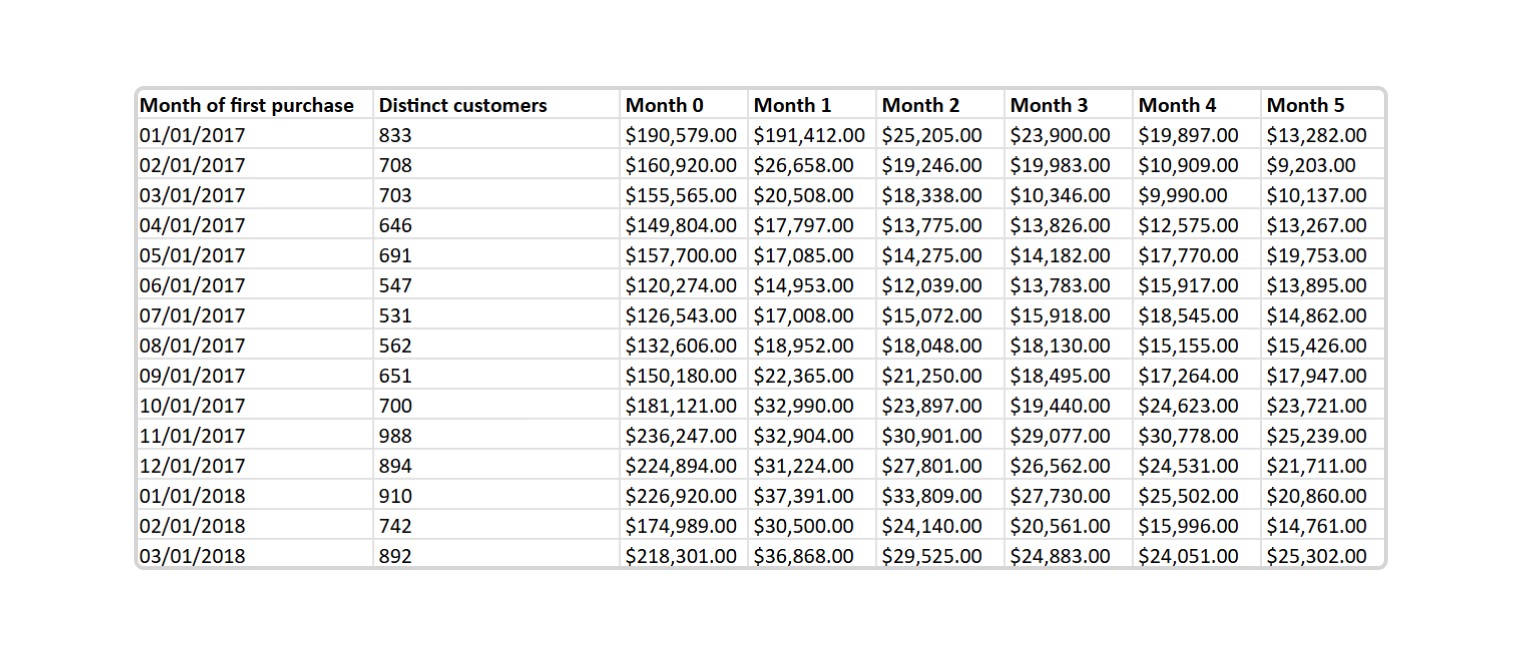
The way to read this is: the 833 new customers from January 2017 spent $190,579 in Month 0, $28,671 in Month 1, etc… You can see the big spike in revenue in Month 0 (P0) for every cohort, and a big drop Month 1 (P1). Again, this is typical in ecommerce, where your cohort of first-time customers make their first purchases, then come back on their own time from there.
Okay, let’s now break this down per customer. Divide the revenue cells by the number of distinct customers in the cohort.
Average revenue per customer by month

Now, let’s blend our data: let’s get medians across our cohorts.
P0 median is: $236.70
P1 median is: $33.51
You can see that P2, P3, P4 continue to drop. Rather than calculate the medians of each of these, we’re going to treat this like retention because that’s what it is: noisy customer churn is lowering revenue every month.
So then let’s calculate retention. We’re going to start from P1, rather than P0, since there is a linear pattern starting in P1 (and not P0).
Revenue-retention from P1

The formula here for each cell is (Pn/P1)^(1/(n-1)).
You can see some months we have retention over 100%. This is probably due to seasonality (eg December sales) or special promotions for that cohort. But on the whole, our month to month retention is below 100% (note that it should be, and this formula only works when retention is less than 100%).
Taking the median of all months from all cohorts, we get:
r median is: 97.0%
Our formula
Now we have all the variables we need to determine LTV with this sample dataset. Remember, we will use the formula:
Except we are going to split out P0 from P1 onward like so, because again, P0 is an anomalous month, while P1 is the beginning of a linear pattern, and we can apply a retention rate against it:

This is the same formula above, except we have separated out our first month to p0, then we’re applying a standard retention rate to p1. Since our dataset is in revenue, we’re also going to apply our profit margin mr. In this example, let’s use a 20% profit margin.
We have also not discussed discount rate, i. These can be anywhere from annual 5% to 50%+, depending on the risk of the company and their type of financing. We will use a generic annual 10% in our example, which we need to convert to monthly since our formula is month-to-month based: this is 0.8% (discount rates are too complex to explain in this post here).
So we now have:
p0 of $236.70
p1 of $33.51
r of 97.0%
i of 0.8%
Profit margin of 20%
Our formula looks like this:
This gives an LTV of $218.42 in this sample dataset.
Discussion
As discussed in the beginning, there are several things we can do with this figure:
Our marketing and user acquisition teams can now try to acquire customers below $218.42 and know within reason they’re making an ROI positive decision.
Our merchandisers and product managers may be unhappy with the $236.70 zero-month revenue figure per customer and try to increase that via improved merchandise and upselling. This would certainly increase our LTV.
Our CRM/email marketing team can try to improve the retention rate with better campaigns. This would certainly increase our LTV.
A good analysis from here is to run a sensitivity analysis and understand the levers most impacting our LTV.