Customer lifetime value in ecommerce: A practical guide to calculating LTV

How to calculate customer lifetime value using purchase cohorts, understand what customers are actually worth, and make better acquisition and retention decisions.
Customer lifetime value (LTV) is one of the most useful metrics in ecommerce. It's also one of the easiest to calculate poorly.
The familiar formula looks something like this:
LTV = Average order value × Purchase frequency × Customer lifespan
It's a reasonable starting point. But it assumes we can meaningfully describe a customer's purchasing behavior with three averages.
In ecommerce, that rarely tells the whole story.
Some customers purchase once and disappear. Others make their second purchase three weeks later, then don't return for another year. Some increase their order values over time. Others only come back when there's a discount.
The result is that two customers with identical first purchases can have dramatically different lifetime values.
Rather than trying to predict how long the average customer will stick around, I prefer starting with something more tangible: how much revenue does a group of customers actually generate in the months following their first purchase?
We can answer that question with a cohort analysis, then use the results to understand acquisition costs, retention, and profitability.
Let's walk through it.
1. Start with cohorts, not customers
A cohort is simply a group of customers who share a common starting point.
For ecommerce, I generally recommend grouping customers by the month of their first purchase.
For example:
January 2024: 1,000 new customers
February 2024: 1,150 new customers
March 2024: 950 new customers
We then follow each group over time, measuring how much its members spend in each subsequent month.
Importantly, a customer always belongs to their original cohort, even when they return years later.
This lets us answer a useful question: If we acquire 1,000 customers in January, how much revenue do those same 1,000 customers generate over the next year?
Let's take a look at some sample data.
The examples below use synthetic ecommerce data created to demonstrate the methodology. They are not actual customer transactions or industry benchmarks.
Revenue by month since first purchase
Suppose we acquire 1,000 customers in January and observe the following revenue:
Month | Cohort revenue | Revenue per original customer |
|---|---|---|
0 | $100,000 | $100.00 |
1 | $14,000 | $14.00 |
2 | $12,000 | $12.00 |
3 | $10,000 | $10.00 |
4 | $8,000 | $8.00 |
5 | $7,000 | $7.00 |
6–11 | $29,000 | $29.00 |
Total | $180,000 | $180.00 |
Month 0 is the calendar month in which customers made their first purchase. It includes that first purchase and any additional purchases they made in the same month.
Month 1 is the following month, Month 2 is the month after that, and so on.
Notice the sharp decline following Month 0.
That's an important characteristic of many ecommerce businesses. The first purchase generates a large amount of revenue, followed by smaller amounts of revenue as a subset of customers continues purchasing.
But there's another detail worth understanding.
Revenue per customer is calculated using the original cohort size, not just the customers who returned that month.
If 100 of our original 1,000 customers generate $14,000 in Month 1, our revenue per original customer is $14, not $140.
This distinction matters because we acquired 1,000 customers. We need to evaluate the entire group, including those who never purchase again.
2. Calculate cumulative customer value
Once we have revenue by month, calculating observed LTV becomes straightforward.
For each month, add the revenue the cohort has generated up to that point and divide it by the original number of customers.
Revenue LTV at month N = Cumulative cohort revenue through month N ÷ Original cohort size
Here's how our example develops:
Month | Cumulative revenue LTV |
|---|---|
0 | $100.00 |
1 | $114.00 |
2 | $126.00 |
3 | $136.00 |
5 | $151.00 |
11 | $180.00 |
After 12 months, our cohort has generated $180 in revenue per acquired customer.
We can call that our observed 12-month revenue LTV.
The word observed is important. We're measuring something that happened, rather than forecasting the rest of a customer's life.
And the 12-month qualification is equally important.
A customer might come back in Month 18 or Month 30. Their actual lifetime revenue could be considerably higher than $180. But we shouldn't pretend to know when those future purchases will happen.
For most ecommerce businesses, I'd start by calculating LTV at 3, 6, 12, and 24 months, assuming sufficient purchasing history is available.
These fixed horizons make it much easier to compare cohorts fairly.
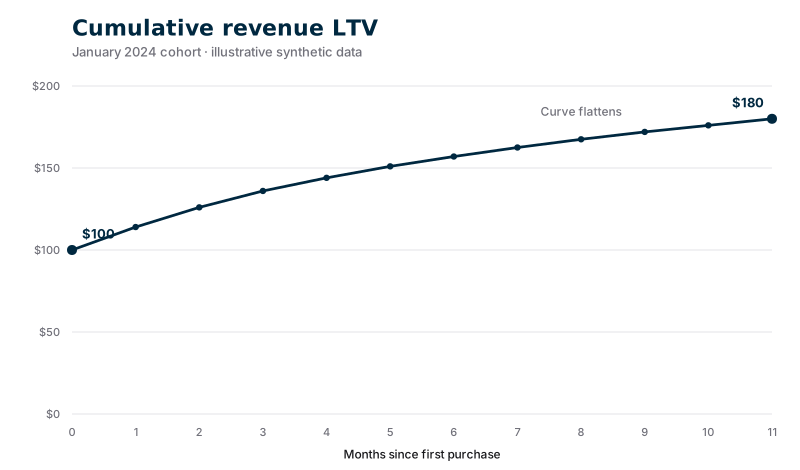
Cumulative revenue per original customer, January 2024. The curve flattens after the first purchase as repeat-purchase revenue declines. Illustrative synthetic data.
3. Revenue LTV isn't profit LTV
This is where the calculation becomes much more useful.
A customer who generates $180 in revenue doesn't generate $180 in profit.
We have to pay for the products they purchase, fulfillment, payment processing, and other costs associated with their orders.
For acquisition decisions, I generally prefer contribution margin: the revenue remaining after the variable costs of serving those orders, but before customer acquisition cost and shared fixed overhead.
For example:
Contribution = Net revenue − Product costs − Fulfillment costs − Payment fees − Other variable order costs
Make sure discounts, refunds, and returns are accounted for consistently. Depending on your business, variable costs might also include shipping subsidies, returns processing, and incremental retention incentives.
For simplicity, let's assume our example business generates a 40% contribution margin on its net revenue.
That means every $100 of revenue produces $40 of contribution before acquisition costs.
Our $180 in 12-month revenue LTV becomes:
$180 × 40% = $72 in 12-month contribution LTV
That's a very different number.
If our business spends $55 to acquire each new customer, the economics look like this:
Metric | Per customer |
|---|---|
12-month revenue LTV | $180 |
12-month contribution LTV | $72 |
Customer acquisition cost | $55 |
Contribution after acquisition | $17 |
We have generated $17 per acquired customer over the first 12 months, before accounting for shared overhead and other costs not included in the contribution calculation.
This business might still be attractive. It could generate meaningful contribution in years two and three, and its fixed operating costs might be relatively low.
But it's a much more realistic assessment than looking at $180 of revenue against $55 of acquisition cost and declaring victory.
In fact, those two numbers produce an impressive-looking revenue LTV-to-CAC ratio of 3.3.
On a contribution basis, the ratio is only 1.3.
Same customers. Same orders. Very different conclusions.
4. Understand how long it takes to recover acquisition costs
Knowing that a customer eventually becomes profitable is useful. Knowing when they become profitable can be just as important.
Let's return to our example.
We spent $55 acquiring a customer, and we expect a 40% contribution margin.
Here's our cumulative contribution LTV:
Month | Cumulative contribution LTV |
|---|---|
0 | $40.00 |
1 | $45.60 |
2 | $50.40 |
3 | $54.40 |
4 | $57.60 |
5 | $60.40 |
11 | $72.00 |
Our cohort doesn't recover its $55 average acquisition cost until Month 4.
In other words, we wait about four months after acquisition to recover our marketing investment on a cohort-average contribution basis.
This is our contribution-margin CAC payback period. It is not necessarily the month when every individual customer pays back, and it isn't a complete cash-flow calculation.
For a well-capitalized business, that might be perfectly acceptable.
For a business with tight cash flow, rapidly growing acquisition spend, and inventory to finance, the same payback period could become a constraint.
Two acquisition channels might generate identical 12-month LTV but very different payback periods. One produces most of its value in the first 30 days, while the other depends on purchases six months later.
That difference should influence how aggressively we spend.

Cumulative contribution per original customer against a $55 acquisition cost. The cohort average crosses that cost in Month 4 and reaches $72 by Month 11. Illustrative synthetic data.
5. Compare cohorts to understand whether the business is improving
So far, we've followed a single group of customers.
The real value comes when we repeat this exercise across many cohorts.
Imagine comparing customers acquired in January, February, March, and every subsequent month.
We can organize those results into a cohort table:
Rows represent the month of first purchase.
Columns represent months since acquisition.
Each cell shows revenue or contribution per original customer.
This gives us a consistent way to compare customer quality.
For example, say our January customers generated $130 per customer over their first three months, while April customers generated $155 over the same period.
That might suggest our newer customers are more valuable.
But before celebrating, we'd want to investigate why.
Did we acquire customers through different marketing channels? Did our merchandise mix change? Was April's average first order larger? Did promotional activity or seasonality influence spending?
A cohort analysis tells us what changed. It doesn't automatically tell us why.
It also helps us avoid a common analytical mistake: comparing older and newer customers without accounting for how long they've had to purchase.
A cohort acquired 24 months ago has had more opportunities to generate revenue than one acquired 3 months ago.
We should compare both at Month 3, Month 6, or another common horizon.
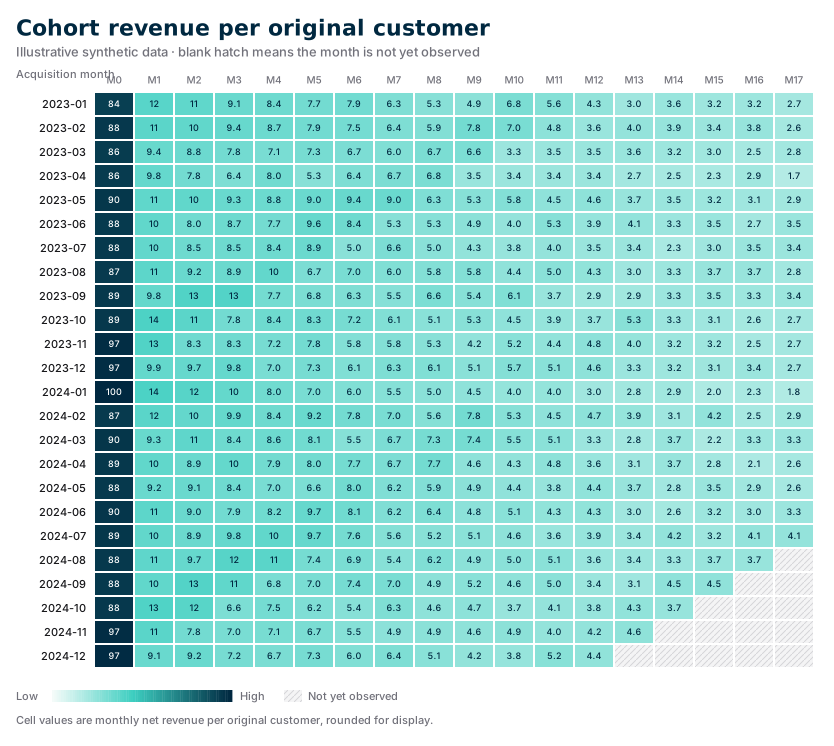
Monthly revenue per original customer by acquisition cohort. Hatched cells are months that could not yet be observed by December 2025. They are not zeros. Illustrative synthetic data.
6. Segment lifetime value to make better decisions
The average LTV across an entire ecommerce business is useful for financial planning. It's usually less useful for deciding what to do next.
Consider a store selling several categories of products.
Customers whose first purchase is a replenishable product might come back every two months. Customers purchasing an expensive, durable product might not return for another year.
Their aggregate LTVs might be similar, but the strategies for retaining them should be completely different.
I like analyzing LTV across several dimensions:
Acquisition channel
Are customers acquired through paid search worth more than those acquired through paid social? Do affiliate promotions attract customers who only purchase with a discount?
Importantly, acquisition channel should be assigned at the customer's initial purchase, rather than attributing every future transaction to whichever channel brought them back.
First product or product category
Does acquiring someone through an entry-level product lead to a valuable long-term relationship? Which initial purchases are most strongly associated with future purchasing?
This can influence merchandising, product recommendations, and which products we feature in acquisition campaigns.
Promotional versus full-price acquisition
How do customers acquired during a major sale behave afterward? Are they likely to purchase again at full price, or do they return only during subsequent promotions?
A high initial conversion rate is less attractive if we're acquiring customers who require increasingly expensive incentives to return.
Customer geography or other relevant attributes
Shipping economics, product availability, and purchasing behavior can vary considerably across markets.
For each segment, I'd compare revenue LTV, contribution LTV, acquisition cost, and payback period at the same observation horizon.
The goal isn't simply to identify which customers spend the most.
It's to understand which kinds of customer relationships are most economically attractive.
7. Use LTV to evaluate your retention strategy
Lifetime value is often treated primarily as a metric for acquisition teams.
I think it's just as useful for lifecycle marketing.
For a marketer building email, SMS, and other retention programs, the key question is: Where in the customer lifecycle can we create additional purchasing behavior?
A cohort analysis helps identify where to investigate.
First purchase to second purchase
For many ecommerce businesses, a customer's first repeat purchase is a particularly important milestone.
We should measure the percentage of each acquisition cohort that makes a second purchase within 30, 60, 90, and 180 days.
This is different from the percentage that purchases in any particular calendar month. A customer might skip Month 1 and return in Month 3.
We can then consider initiatives like post-purchase education, product recommendations, replenishment reminders, or a second-purchase offer.
Time between purchases
For customers who do return, how long does it typically take?
A customer buying coffee has a different expected repurchase cadence than one buying furniture.
Understanding these patterns can help us build communications around likely customer needs rather than arbitrary schedules.
Revenue and margin from returning customers
More orders aren't always more profitable orders.
A campaign that generates additional purchases through heavy discounts might increase revenue LTV while barely improving contribution LTV.
That's why I recommend evaluating retention efforts on incremental contribution, not simply attributed revenue.
Whenever practical, use holdouts or controlled experiments to establish whether a program actually creates additional value.
A cohort whose LTV rises after launching a welcome series doesn't, by itself, prove that the welcome series caused the increase.
8. Understand which variables have the greatest impact
With a working LTV model, we can evaluate how changes in the business affect customer economics.
Let's return to our illustrative customer:
$180 in 12-month revenue
$72 in contribution
$55 acquisition cost
$17 remaining contribution after acquisition
Now suppose we can increase repeat-purchase revenue by 10%, without changing first-month revenue or contribution margin.
Our existing customer generates $100 in Month 0 and $80 in subsequent months.
A 10% improvement on that $80 produces $8 in additional revenue.
At a 40% contribution margin, that's another $3.20 in contribution.
Our 12-month contribution LTV improves from $72 to $75.20.
Alternatively, a five-percentage-point improvement in contribution margin across all orders, from 40% to 45%, increases contribution LTV to $81.
That's a $9 improvement without acquiring any additional customers.
These examples aren't forecasts. They're sensitivity analyses: a way to understand which variables matter and how much they're worth changing.
A good model should let us experiment with acquisition costs, margins, repeat purchases, and the timing of those purchases. The workbook linked below has editable cells for CAC, contribution margin, and repeat-purchase revenue uplift.
9. How to calculate LTV with your own ecommerce data
You don't need particularly sophisticated infrastructure to get started.
Ideally, you need an order-level export containing the customer ID, order date, order ID, net revenue, and the variable costs associated with each order.
A first-purchase acquisition channel and product category are useful if you want to segment the analysis.
From there, the process is:
Identify each customer's first valid purchase. Use a stable customer identifier so returning customers don't accidentally appear as new customers.
Assign each customer to a first-purchase cohort. Monthly cohorts are a good default, although some businesses benefit from weekly or quarterly cohorts.
Assign every subsequent order to that original cohort. Calculate the number of months between the order and the customer's first purchase.
Aggregate revenue and contribution by cohort and month. Divide by the number of customers originally acquired, including customers who never return.
Calculate cumulative values at consistent horizons. Start with 3, 6, and 12 months, adding longer horizons when your history supports them.
Join acquisition costs to the appropriate cohorts. Calculate CAC and the month at which cumulative contribution exceeds that cost.
One important detail: only compare cohorts with sufficient history for the metric you're calculating.
If a customer was acquired two months ago, you can't calculate their observed 12-month LTV.
You can forecast it, but that forecast should be clearly distinguished from actual results.
If you're using Shopify, its customer cohort reports provide a useful starting point for spending and purchasing behavior. A data warehouse or order export gives you more control over contribution costs, customer identity, and acquisition attribution.
So, what is a customer actually worth?
There isn't a single universal answer.
A customer might generate $100 on their first purchase, $180 over their first year, and considerably more over the next several years.
Some of that revenue will disappear into the costs of fulfilling their orders. Some customers will never purchase again. Others will become remarkably valuable over time.
That's precisely why I prefer measuring LTV by cohort, over clearly defined periods, with revenue and contribution calculated separately.
It gives us something practical to work with.
We can decide which acquisition channels deserve more budget, which types of customers we'd like to attract, and which retention initiatives are worth prioritizing.
And rather than arguing about one theoretical lifetime value number, we can observe whether the customers we're acquiring today are becoming more valuable than the customers we acquired a year ago.
That's where LTV becomes genuinely useful.
Download the sample ecommerce dataset and LTV analysis workbook to follow these calculations and experiment with your own assumptions. The orders are synthetic.
Download the sample order data (CSV)
Download the LTV analysis workbook (Excel)
The workbook's Orders sheet is the January 2024 reference cohort. The full order file includes every cohort. Download the cohort summary (CSV) if you want the aggregated tables directly.